Data Collection and Statistics
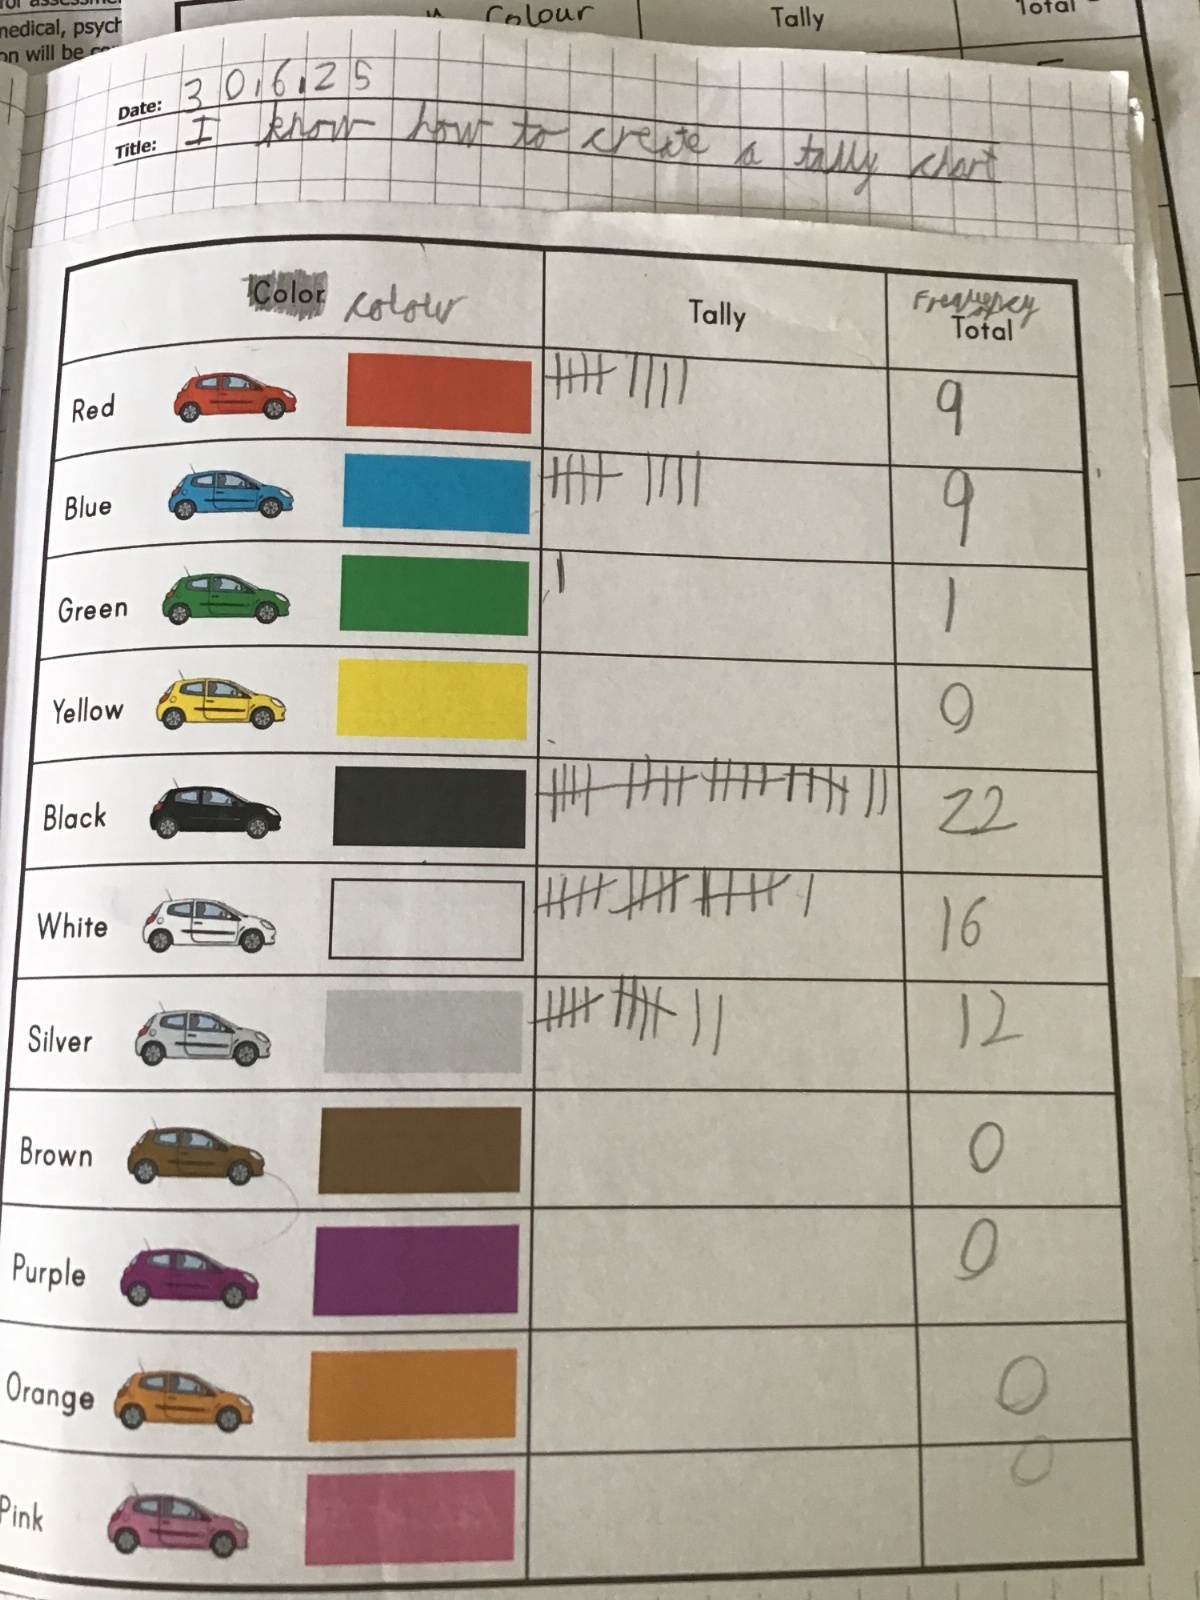
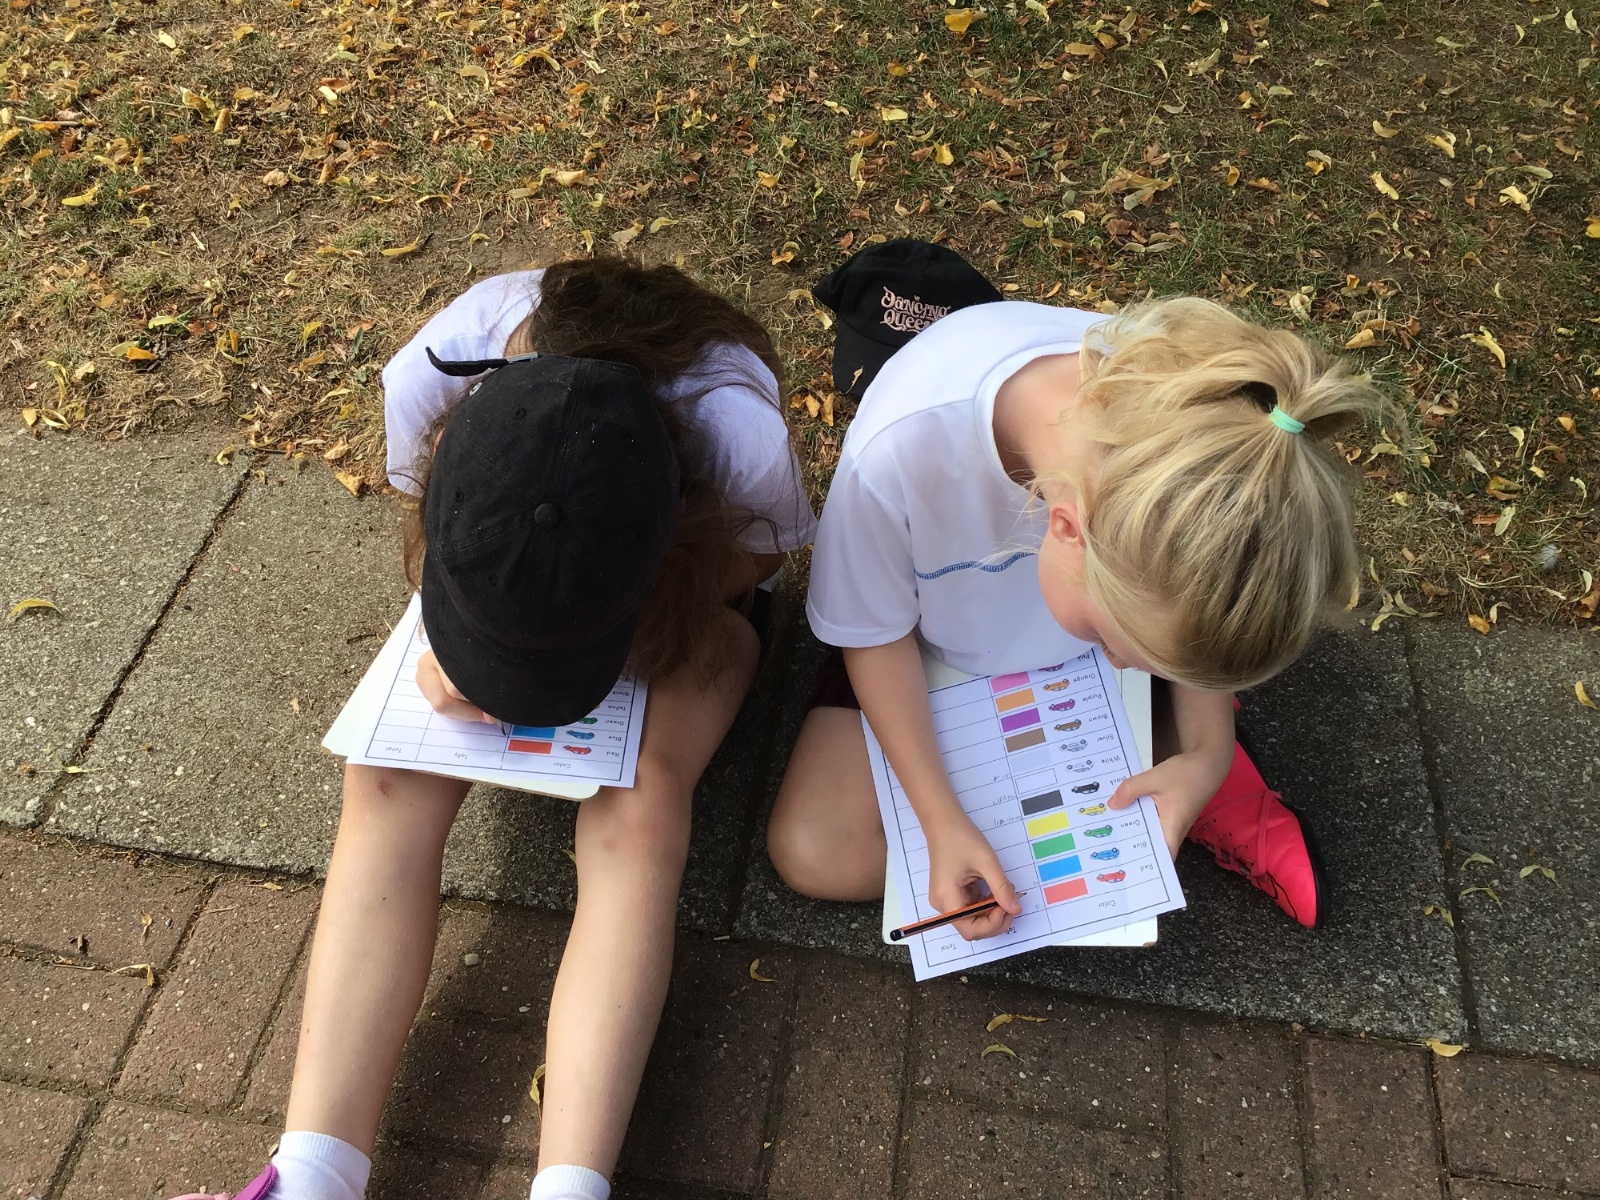
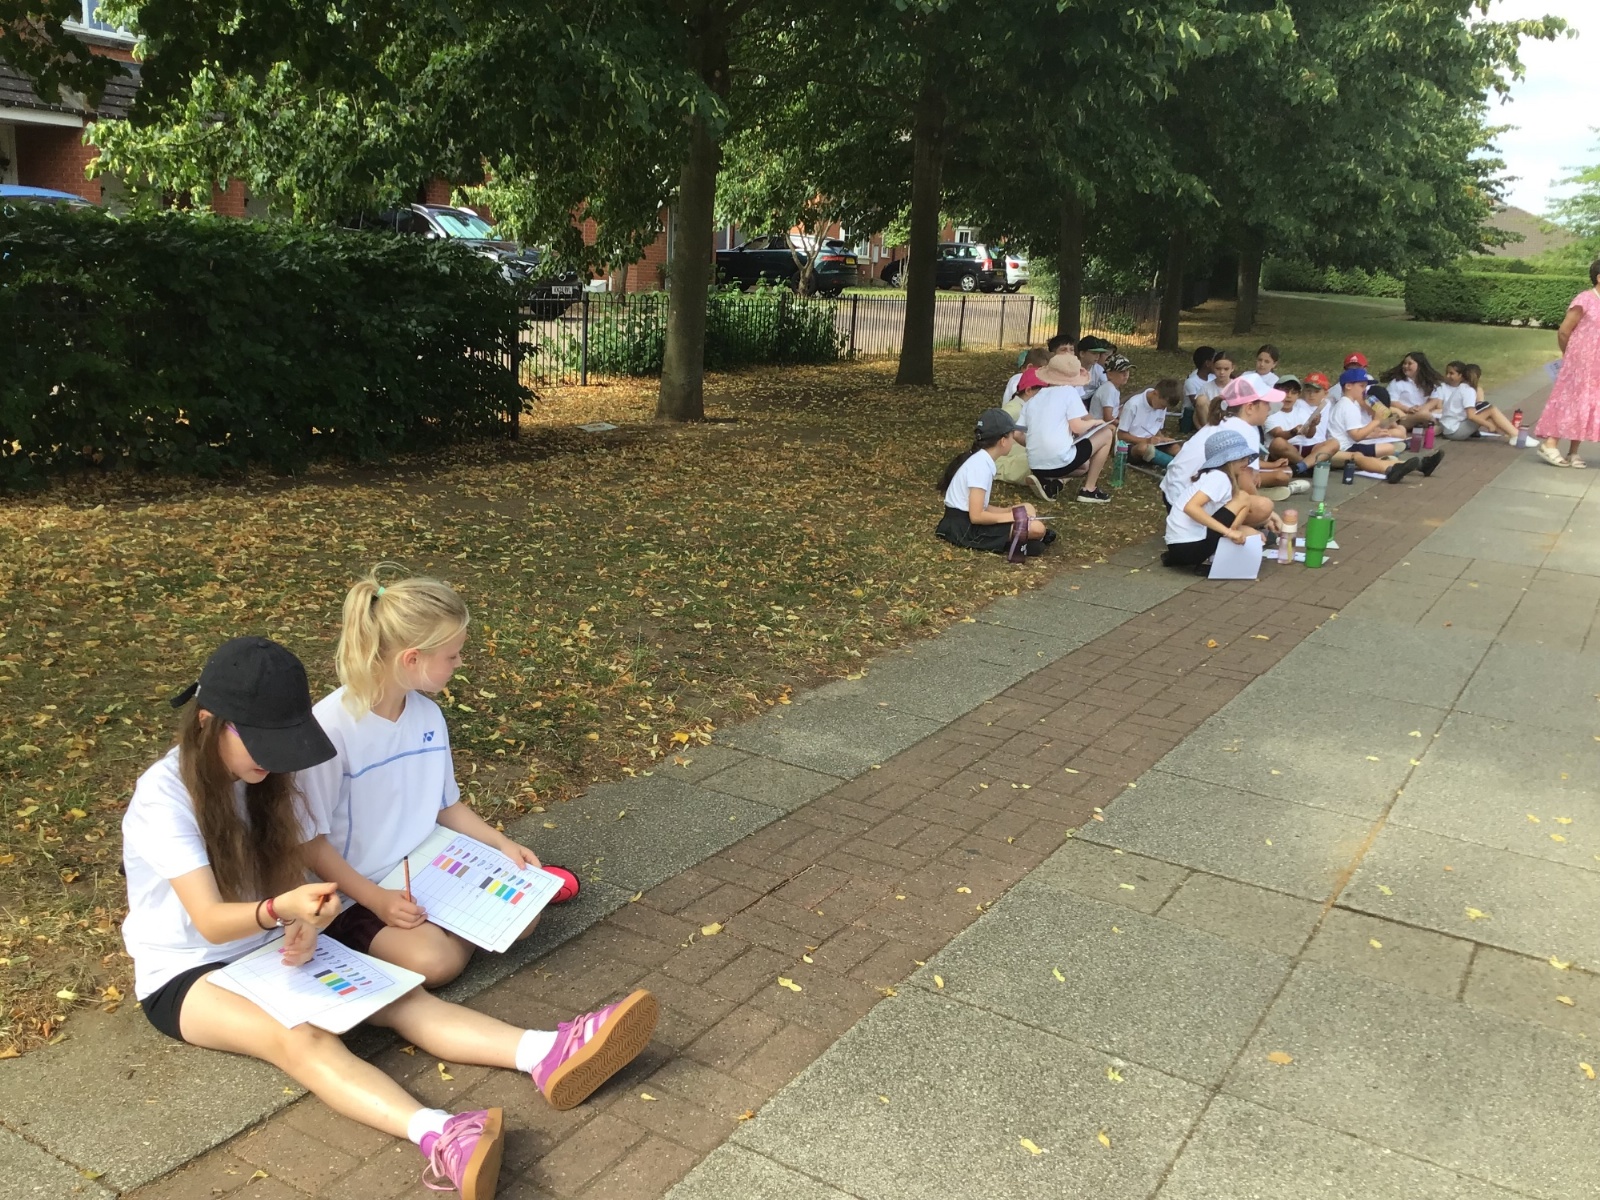
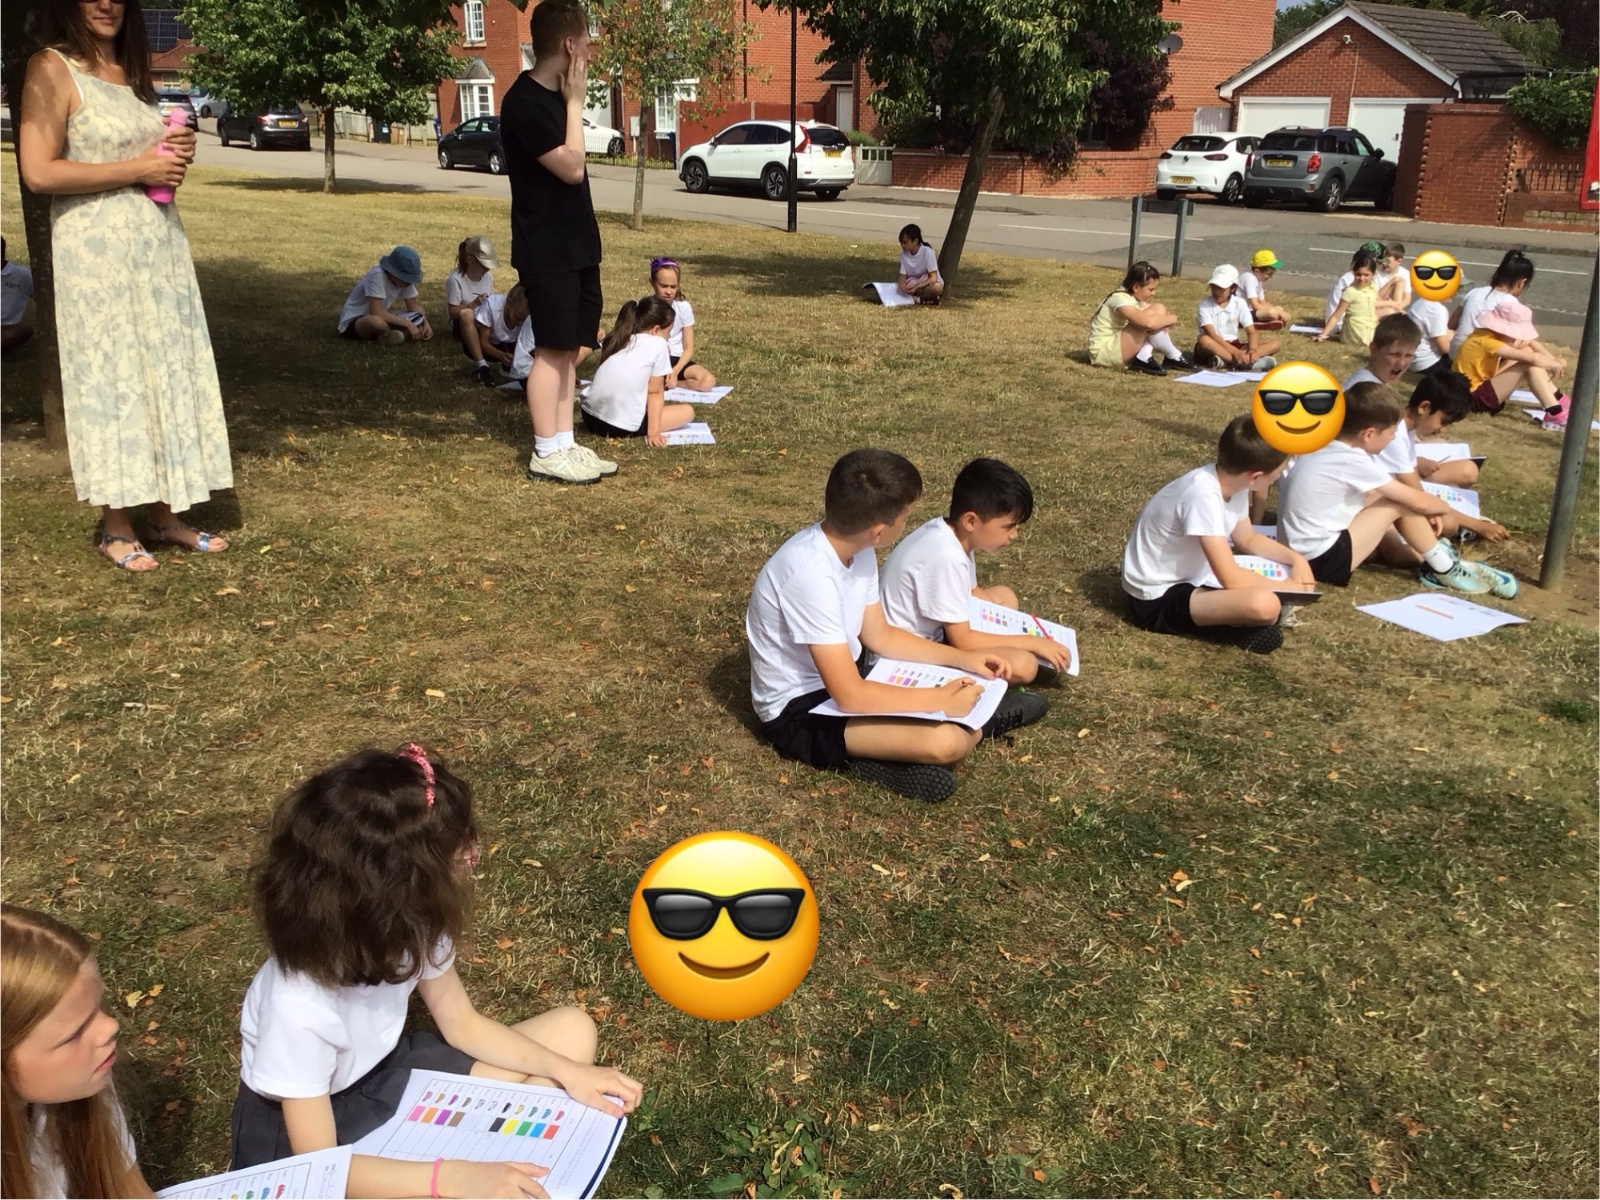
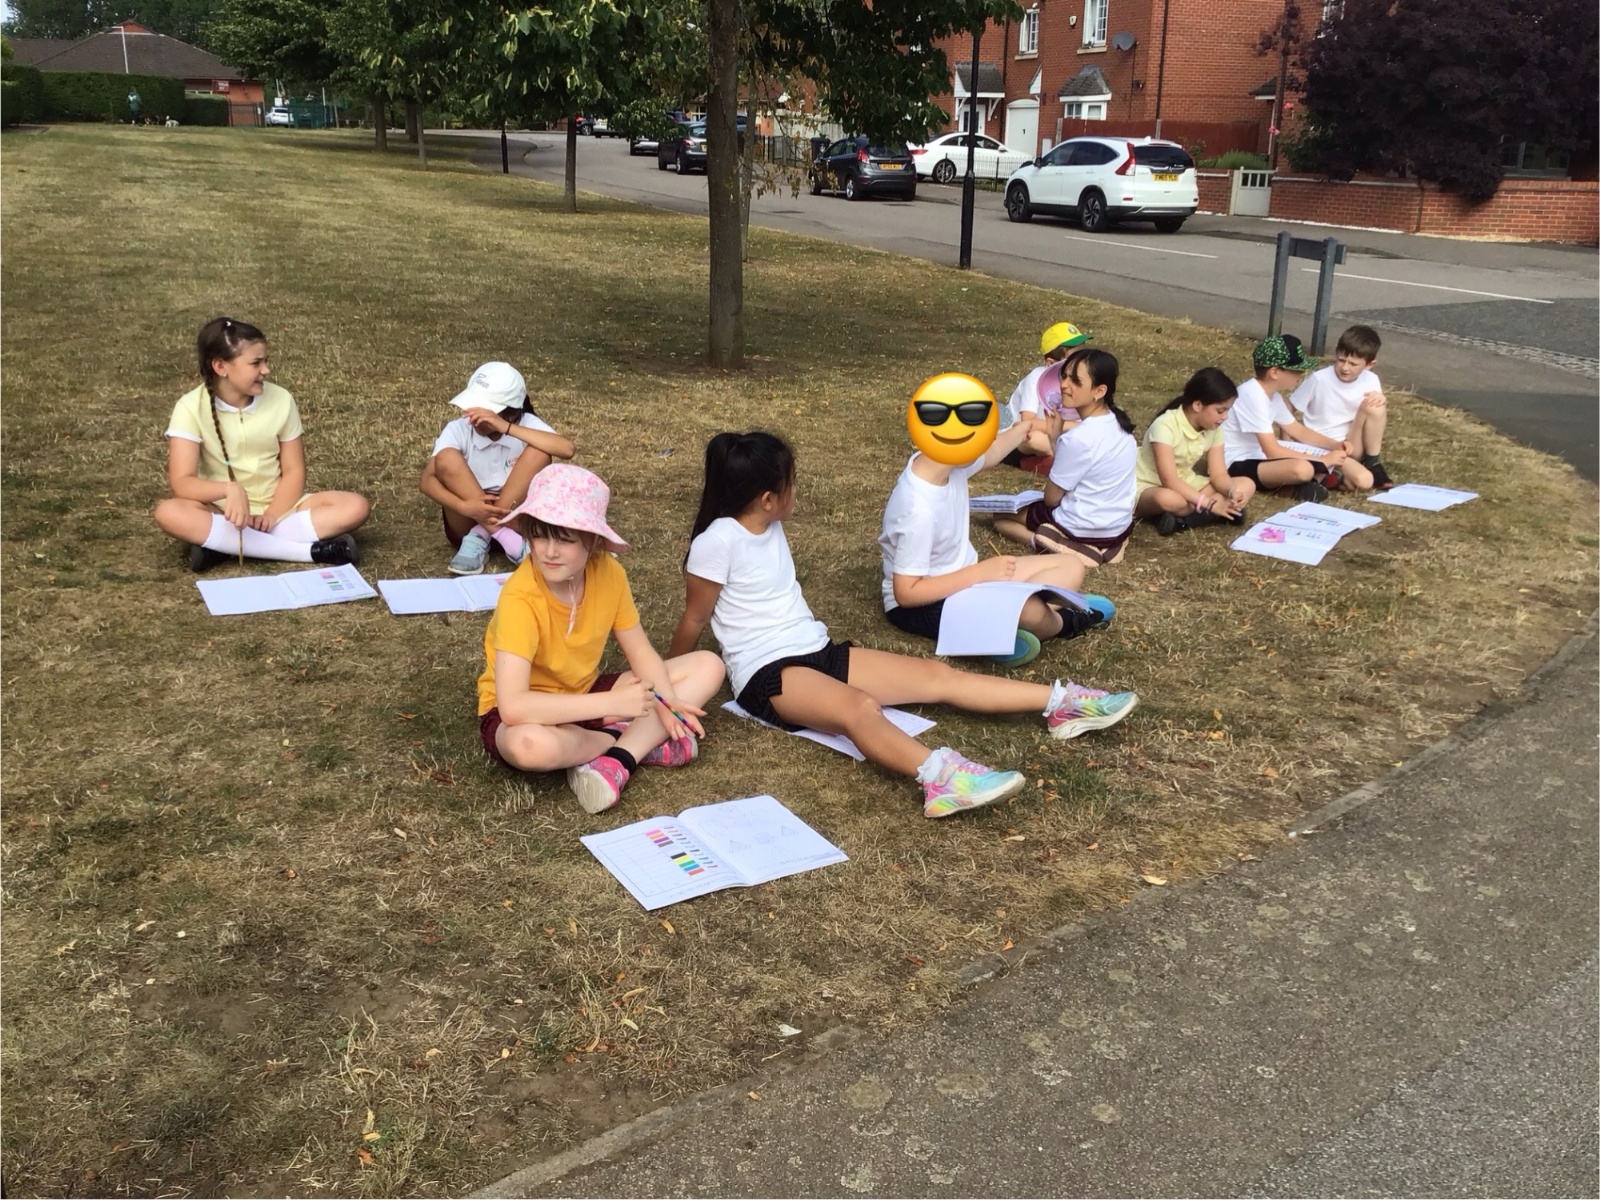
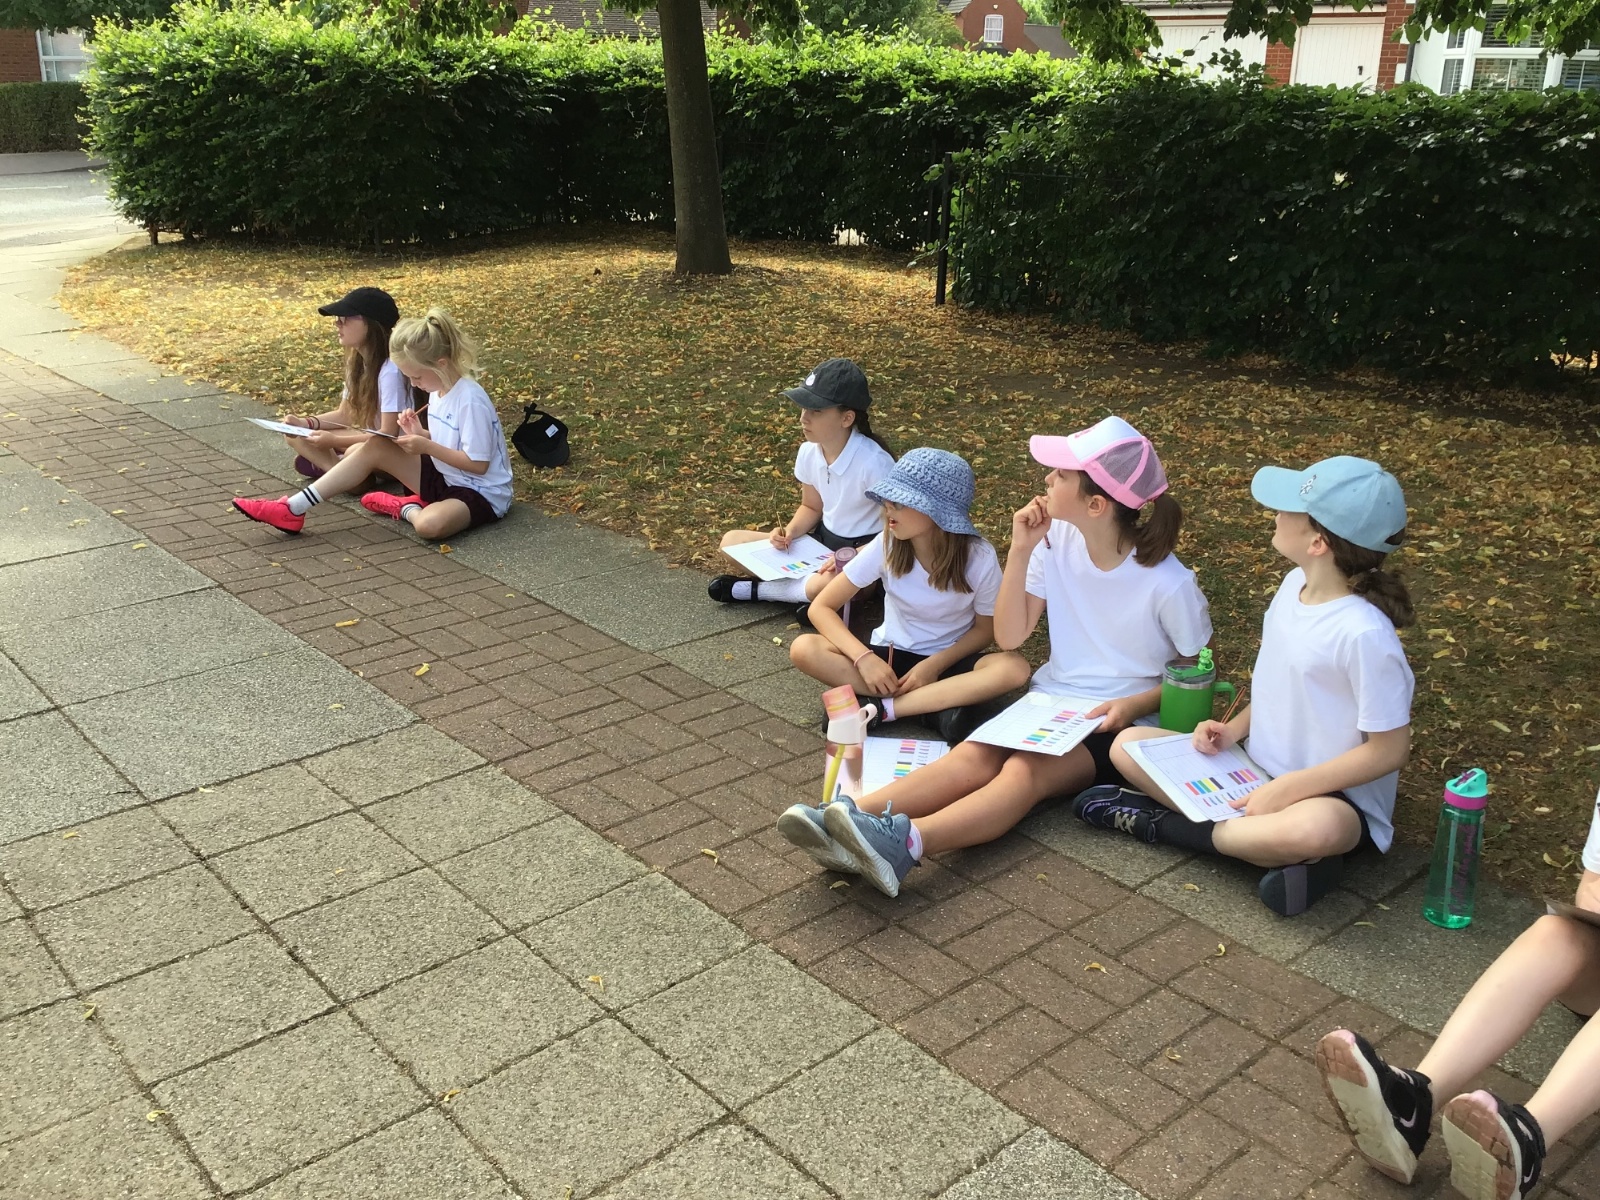
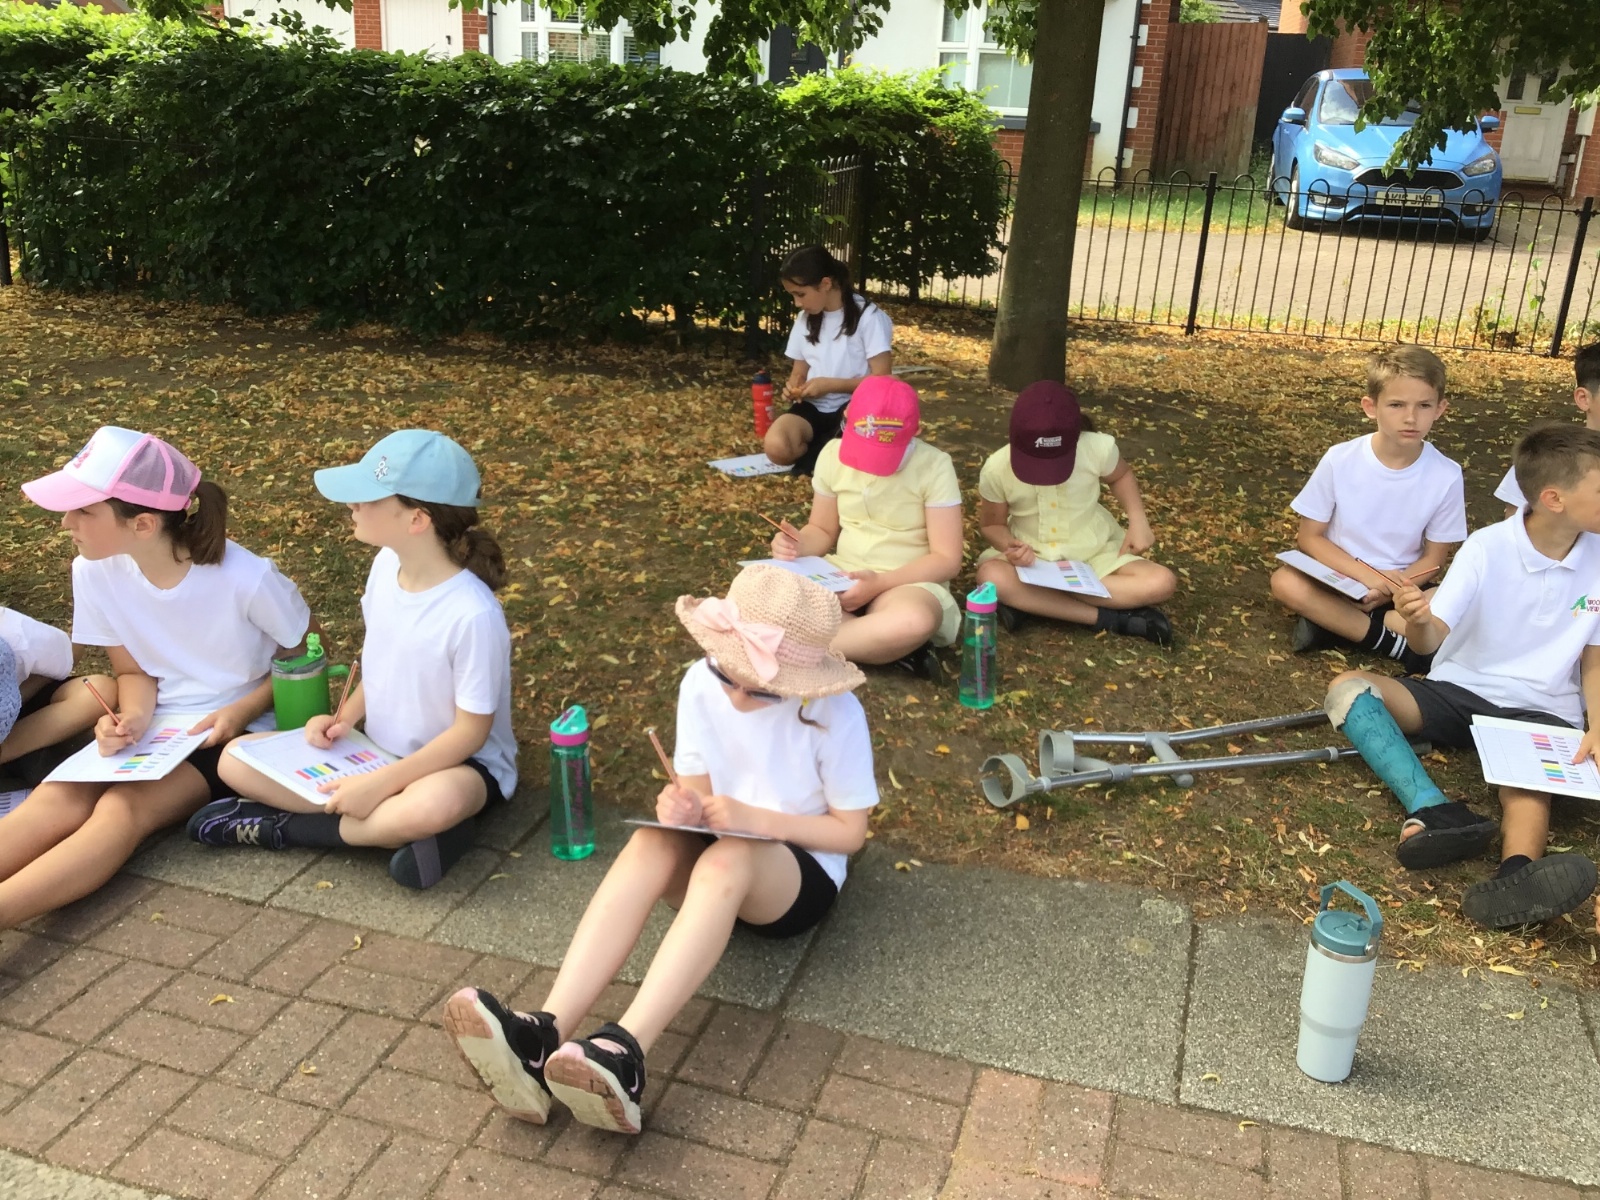
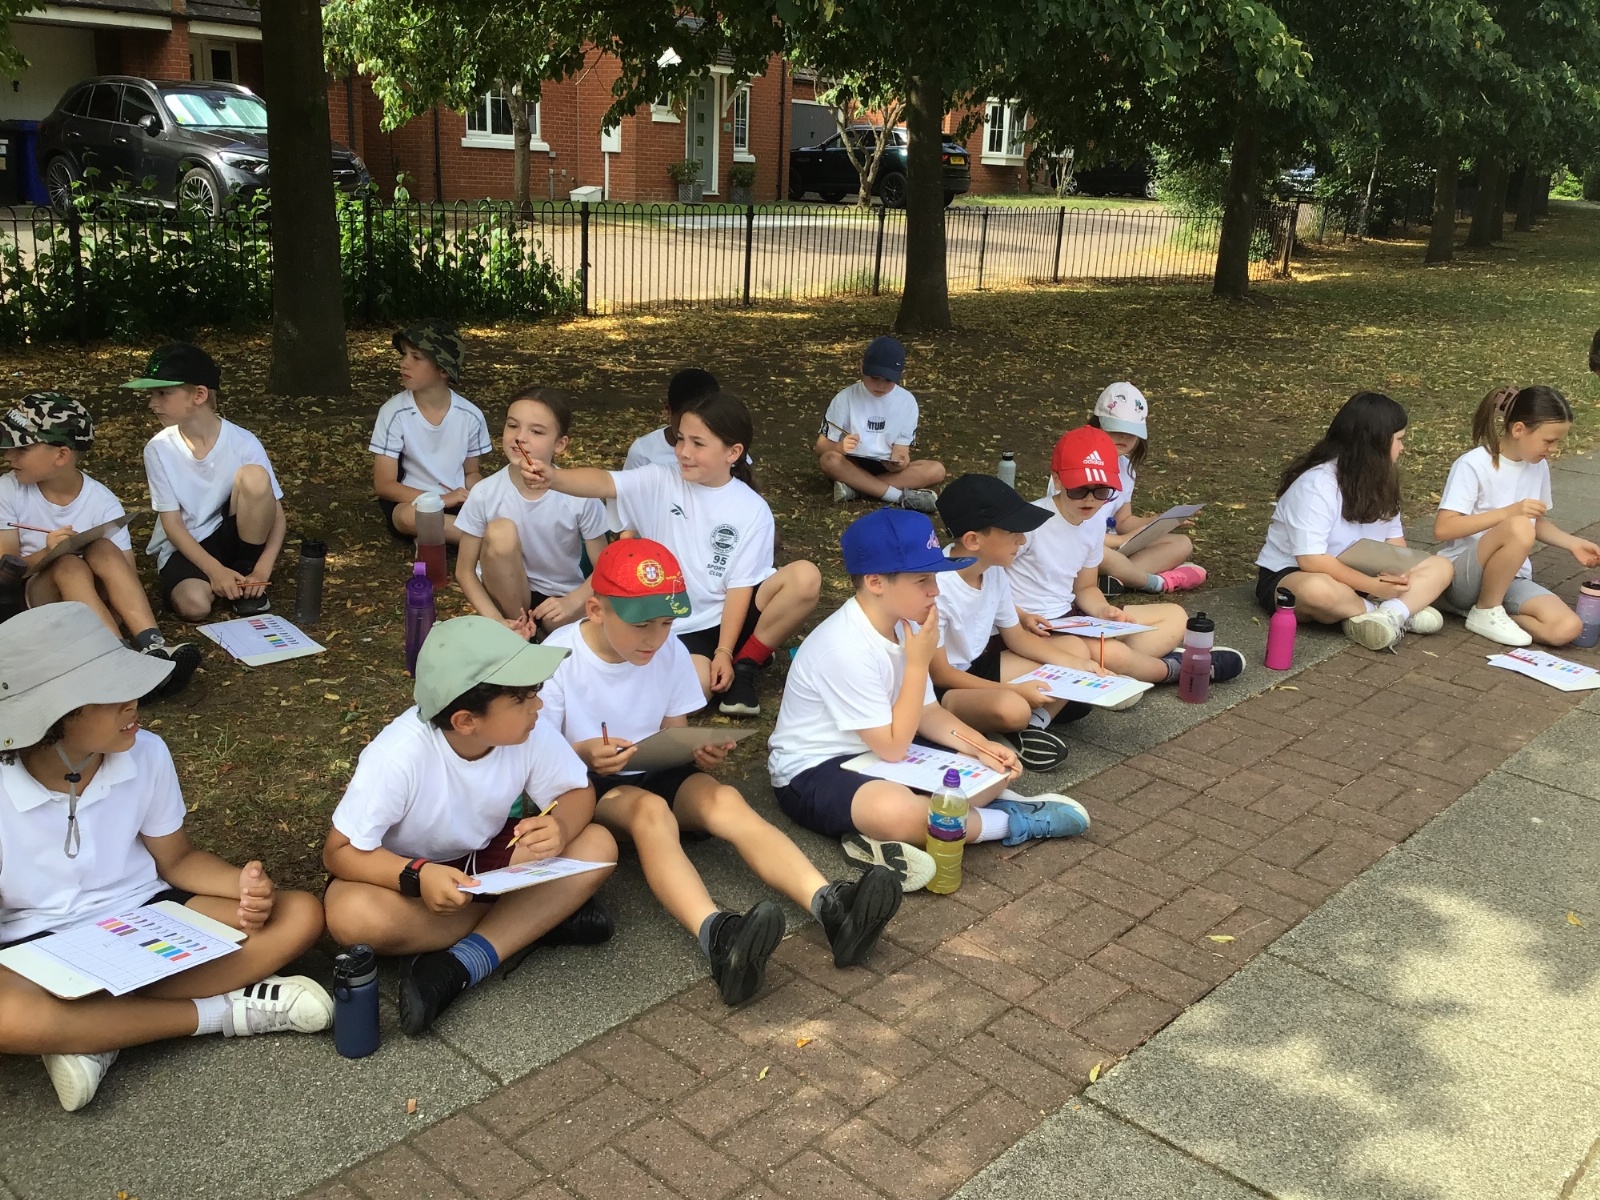
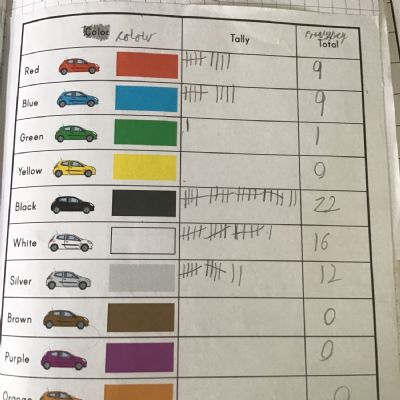
This week, we are working on data collection and statistics. We sat outside for 10 minutes and counted the number of cars and their colours. We completed a tally chart and counted the total/ frequency of each colour. We then used this data to create our own bar chart. We are going to be using this knowledge during our lessons for the rest of the week, when we will be interpreting data to answer a range of questions.
 IMG3421.jpeg14877
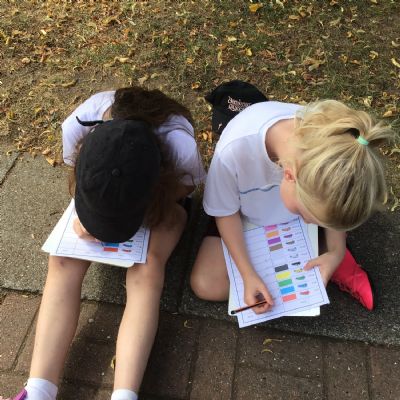 IMG3419.jpeg14876
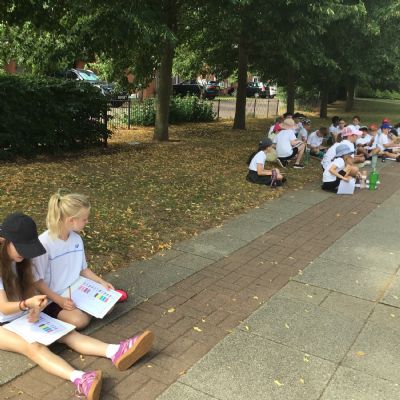 IMG3418.jpeg14875
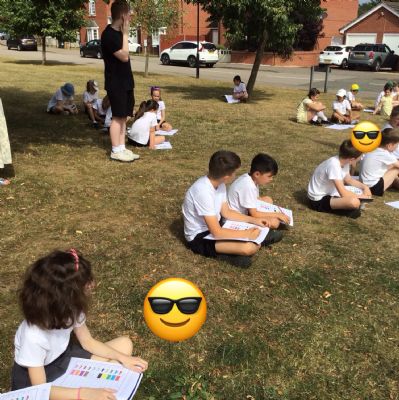 IMG3417.jpeg14874
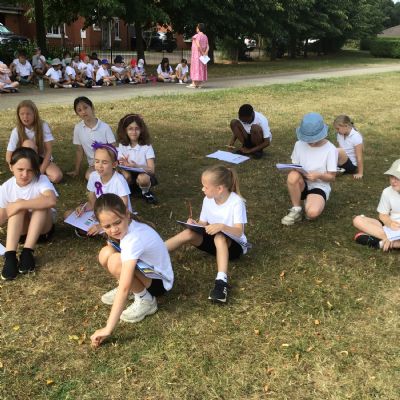 IMG3416.jpeg14873
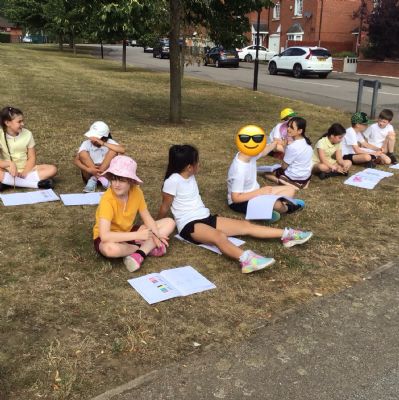 IMG3415.jpeg14872
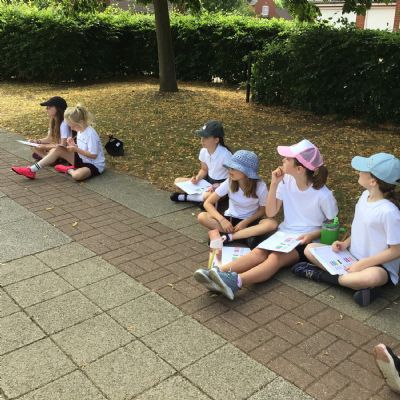 IMG3414.jpeg14871
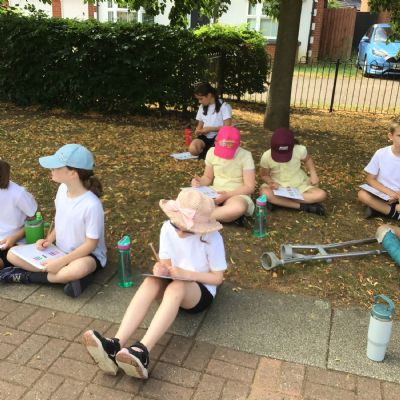 IMG3413.jpeg14870
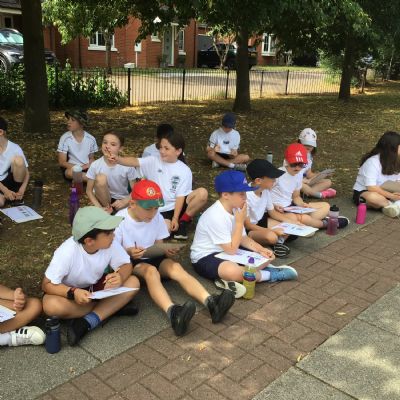 IMG3412.jpeg14869
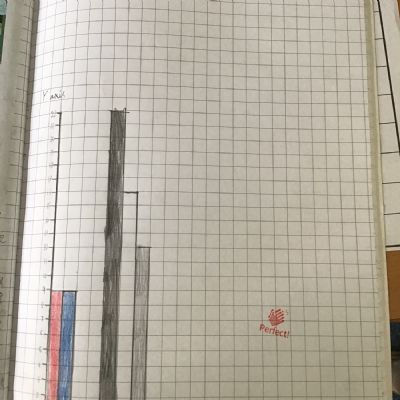 IMG3422.jpeg14878